


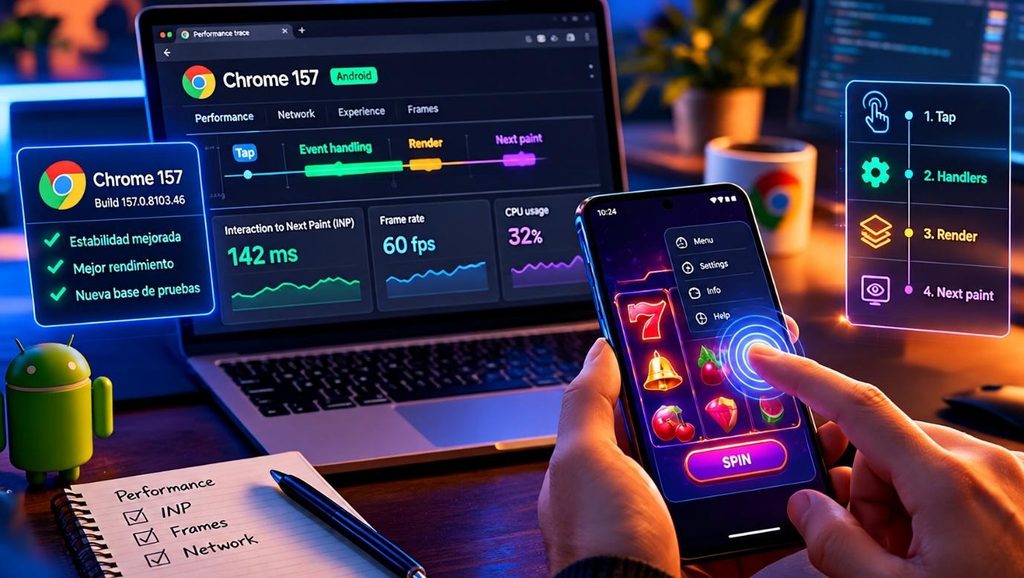
Google released an updated build of Chrome 157 for Android on November 5. The build, version 157.0.8103.46, was scheduled to reach Google Play users over the following days. Google describes the build as including stability and performance improvements. For developers, it provides a new version to test against on a platform where two customers can open the same site on very different hardware.
Start at the tap, then watch the frame
When someone opens a menu, dismisses a panel or selects a title from a catalogue, the browser must handle the input and draw the next visible state. The device may be doing several things at once. An animation could already be running, an image may be loading, or a script may be working through a long task. A page that appeared to load quickly can still feel slow when someone starts using it.
A timing trace for slots games can separate three events that feel like one to the person holding the phone. The browser receives the tap, the control changes on screen, and the reel animation begins. If the control responds promptly and the animation then stutters, inspect how the browser draws the moving frames. If the control itself takes time to react, start with the work the browser was already doing when the tap arrived.
Measure the first response separately
One way to measure the browser’s side of the process is Interaction to Next Paint. Google’s explanation of INP describes how it uses qualifying clicks, taps and keyboard interactions to assess a page’s responsiveness over a visit. It includes the time before the browser begins handling the interaction, the time spent running its handlers and the wait for the next frame to appear. The metric captures a moment the user can feel even if they have no idea what the browser is doing.
There is also a distinction between visible feedback and request completion. A page can acknowledge a tap immediately by highlighting a button or displaying a loading state while it waits for data. A request might finish quickly on a fast connection, yet still leave the screen feeling unresponsive if other work delays the first visible change. The two timings are worth recording separately. One says how quickly the interface responded. The other says when the action itself was ready.
Repeat the same action after the update
The Chrome release notice gives the exact build number to record. A useful comparison starts with one action on one device. Open the same page, use the same menu and repeat the action before and after the update under comparable conditions. A cache can change how much work a page has to do, so a test on a fresh visit answers a different question than one after the same site has been used several times. Running both can help identify whether a problem is concentrated at the start of the visit.
Open a panel while its images are still arriving, close it, then try again once the page has settled. If the second tap is consistently faster, inspect the work happening during the first one. The difference might come from a script or an image update scheduled at the same time. Measuring both cases gives the team a lead to follow in a performance trace.
Compare what happens away from the test bench
It’s worth trying the same interaction on a slower phone and on a connection closer to what customers actually use. A developer’s everyday handset may have enough processing power to run several tasks without a noticeable delay. A device with fewer resources can expose an interaction that waits behind a script or a complicated visual update. A slower connection can also change when assets arrive and what’s happening when the user taps.
Testing one action deliberately helps you find the cause. Data from real visits answers a different question: how often does the delay occur for people going about their business? If reports cluster around the first use of a control or around a particular animation, developers have something concrete to reproduce. An average for the whole visit is less useful for diagnosing that problem than a trace of what happened during the action.
Check who owns the embedded interaction
Embedded content adds another wrinkle. A tap inside a third-party frame can be part of the visitor’s experience, even when scripts on the main page cannot inspect its details. That is one reason a developer’s own measurement can differ from a wider picture of the visit. Checking which part of the page received the tap can help explain the difference.
The November release gives teams a new browser baseline and a reason to repeat the checks they already care about. Google has described the improvements at the build level. The experience still depends on the device and the page.