


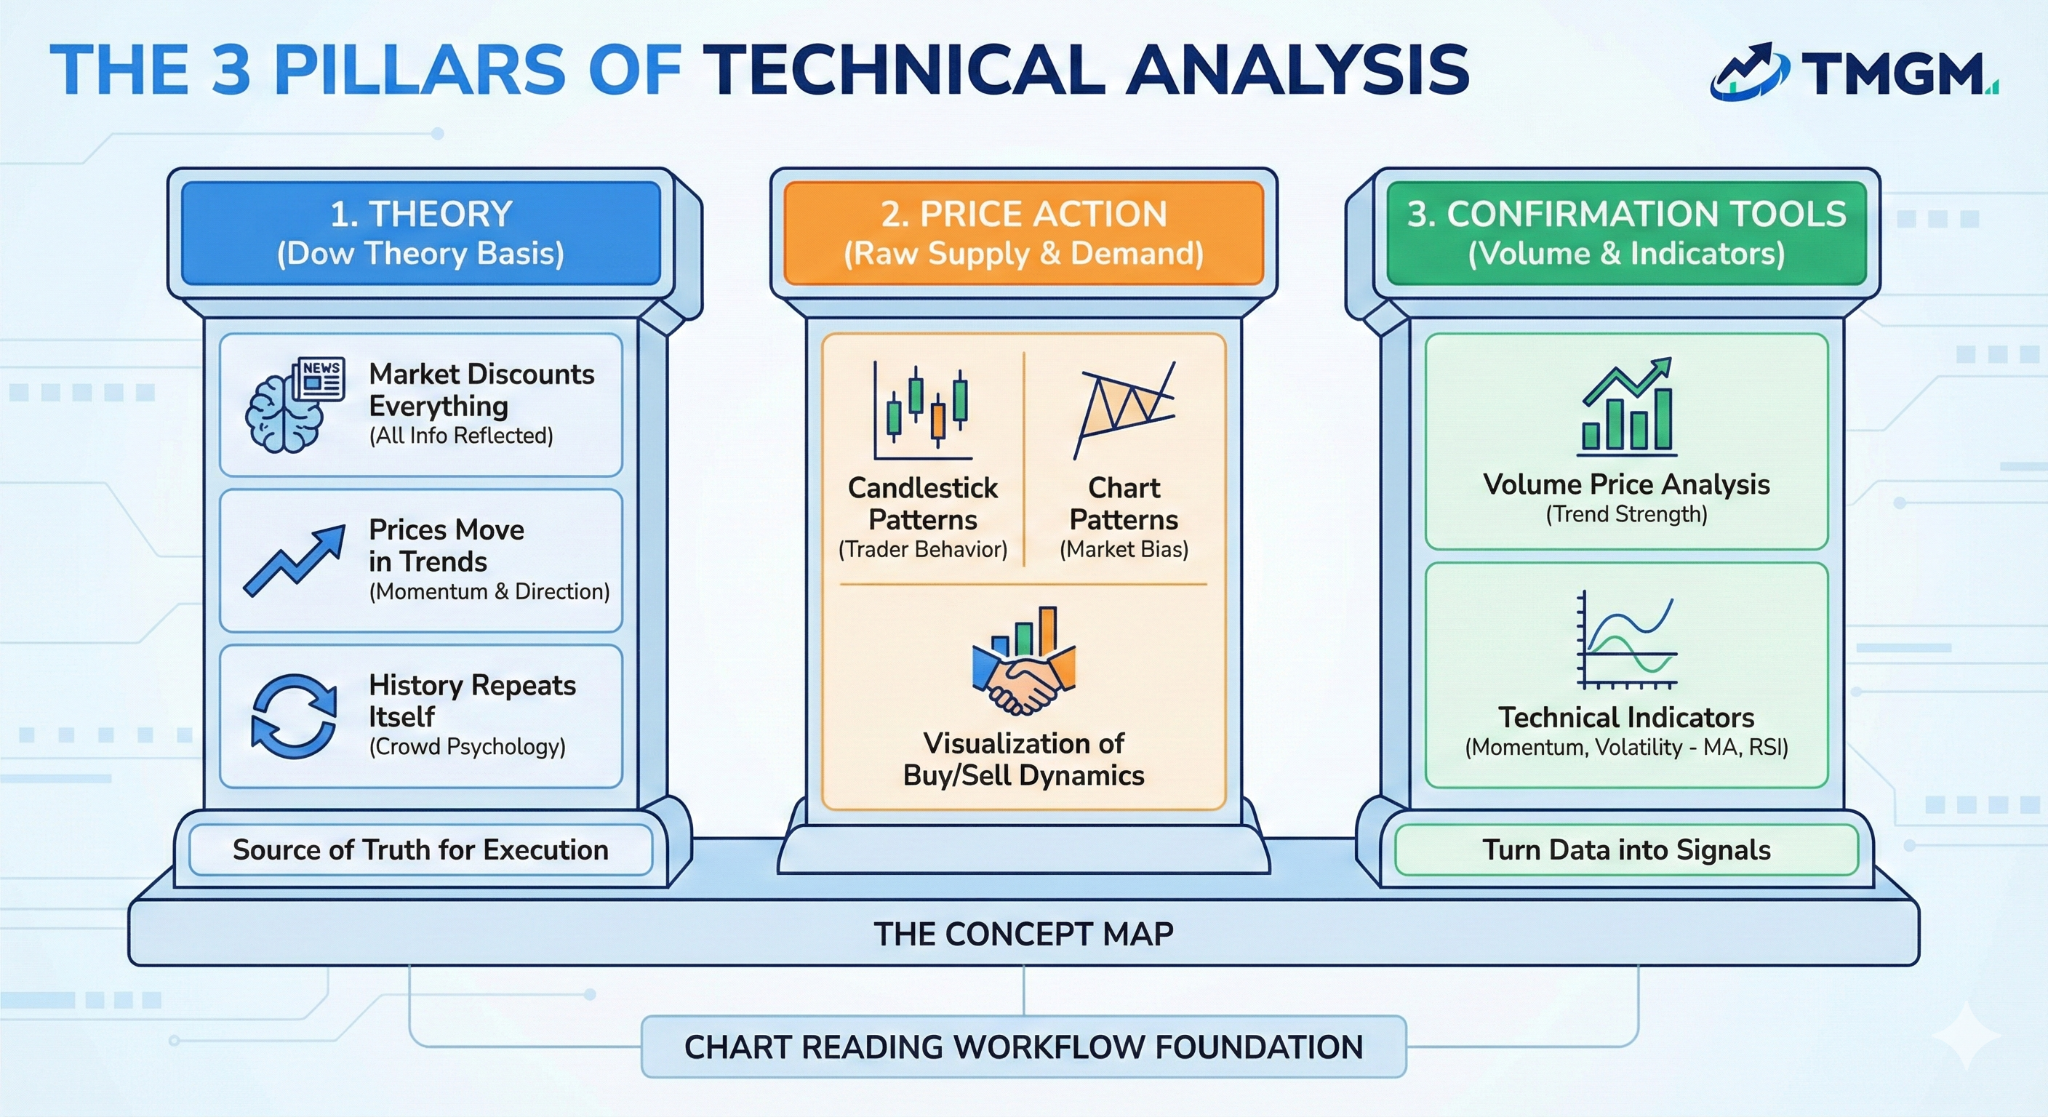
Every price chart tells a story about buyers and sellers, and technical analysis is the skill of reading that story. Whether you trade stocks, forex pairs or crypto, the underlying idea is the same: past price and volume behaviour leaves clues about where the market may go next, and traders can use those clues to plan entries, exits and risk. This guide walks through the core concepts in a logical order, from chart types to a complete trading plan, so you can start applying them with confidence.
The examples below assume you are using TradingView, which is the charting platform most retail traders start with. Its free tier is enough to follow everything here, and because it covers stocks, forex, indices and crypto in one place, you can practise the same techniques across markets without switching tools. None of the concepts are exclusive to it, however; the principles apply on any decent charting software.
Technical Analysis vs Fundamental Analysis
Fundamental analysis asks what an asset is worth. For a stock that means earnings, cash flow, competitive position and management quality. For a currency it means interest rates, inflation and trade balances. For a crypto project it means adoption, tokenomics and developer activity. Fundamentals help you decide what to own over months or years.
Technical analysis asks a different question: what is the market doing right now, and how are participants positioned? It focuses on price action, volume and patterns that repeat because human behaviour repeats. Technical analysis is most useful for timing, which is why many investors combine the two approaches, using fundamentals to choose what to trade and technicals to choose when.
Neither method predicts the future with certainty. Technical analysis is a framework for making probabilistic decisions and managing risk, not a crystal ball. Keeping that mindset from the start will save you a lot of frustration.
Chart Types: Line, Bar, Candlestick and Heikin Ashi
Before reading patterns, you need to understand how price is displayed. Each chart type presents the same data with different emphasis.
- Line chart: Connects closing prices with a single line. It is the cleanest view of the overall trend and is useful for spotting major support and resistance levels without noise.
- Bar chart (OHLC): Each bar shows the open, high, low and close for a period. A small tick on the left marks the open and a tick on the right marks the close. Bars are compact and favoured by some traders for their neutral appearance.
- Candlestick chart: Uses the same OHLC data but fills the area between open and close as a body, with thin wicks marking the high and low. The colour of the body shows whether price closed higher or lower than it opened. Candlesticks make momentum and indecision visually obvious, which is why they are the default for most traders.
- Heikin Ashi: A modified candlestick that averages price data to smooth out noise. Trends appear as long runs of same-coloured candles with few wicks, making them easier to follow. The trade-off is that Heikin Ashi candles do not show true open and close prices, so you should not use them to set precise entry or stop levels.
On TradingView you can switch between these with the chart type dropdown in the top toolbar. A sensible habit is to use candlesticks for analysis and briefly flip to a line chart when you want to see the bigger structure without distraction.
Reading Candlesticks and Key Patterns
A single candle tells you four things: where price opened, how high buyers pushed it, how low sellers pushed it, and where it finally closed. The body size reflects conviction. A long body means one side dominated; a tiny body means the session ended near where it began. Wicks show rejection, meaning price visited a level and was pushed back.
Doji
A doji has an open and close that are almost identical, producing a very thin body with wicks on either side. It signals indecision. On its own it means little, but a doji appearing after a strong trend, especially at a known support or resistance level, warns that momentum may be fading.
Hammer and Shooting Star
A hammer has a small body near the top of the range and a long lower wick, ideally at least twice the body length. It forms after a decline and shows that sellers pushed price down but buyers took control before the close. Its mirror image, the shooting star, has a long upper wick after a rally and suggests buyers were rejected.
Bullish and Bearish Engulfing
An engulfing pattern uses two candles. In a bullish engulfing, a small bearish candle is followed by a larger bullish candle whose body completely covers the previous body. The reverse defines a bearish engulfing. These patterns show a decisive shift in control and are more reliable when they appear at important levels with above-average volume.
The key lesson for beginners is context. A hammer in the middle of a sideways range is noise; a hammer at a well-tested support level on the daily chart is meaningful information.
Support and Resistance
Support is a price area where buying interest has previously been strong enough to halt a decline. Resistance is the opposite, an area where selling has repeatedly capped rallies. These levels matter because traders remember them and place orders around them, which makes them self-reinforcing.
To find them, look for areas where price reversed more than once, where large candles originated, and round numbers that attract attention. Treat them as zones rather than exact lines. When a resistance level is broken and price later returns to it, it often acts as new support; this role reversal is one of the most useful concepts in technical analysis.
On TradingView, the horizontal line and rectangle tools are the simplest way to mark these zones. Draw them on a higher timeframe first, then refine on lower timeframes.
Trendlines and Channels
A trend is a sequence of higher highs and higher lows (uptrend) or lower highs and lower lows (downtrend). A trendline connects at least two swing lows in an uptrend or two swing highs in a downtrend, and it becomes more significant with each additional touch.
A channel adds a parallel line on the opposite side of price, creating a corridor. Price bouncing between the two lines gives you a visual framework for buying near the lower boundary in an uptrend and taking profit near the upper one. A break of the trendline does not automatically mean reversal; often it simply means the trend is slowing. Wait for confirmation, such as a lower low after an uptrend line breaks.
Classic Chart Patterns
Chart patterns are larger structures formed over many candles. They describe the battle between buyers and sellers as it resolves.
- Head and shoulders: Three peaks with the middle one highest, connected by a neckline. A close below the neckline after the right shoulder signals a potential trend reversal from up to down. The inverse version signals a bottom.
- Double top and double bottom: Price tests the same level twice and fails. A double top breaks down when price falls below the trough between the two peaks; a double bottom breaks out above the intervening peak.
- Triangles: Converging trendlines show contracting volatility. Ascending triangles (flat top, rising lows) lean bullish, descending triangles lean bearish, and symmetrical triangles are neutral until the breakout direction is clear.
- Flags and pennants: Short consolidations after a sharp move, sloping against the trend. They usually resolve in the direction of the prior move, making them popular continuation setups.
PatternSignalWhere it appears DojiIndecision, possible reversalAfter extended trends, at support or resistance HammerBullish reversalAt the end of a decline, near support Shooting starBearish reversalAt the end of a rally, near resistance Bullish engulfingBullish reversalAfter a pullback in an uptrend or at support Bearish engulfingBearish reversalAfter a rally or at resistance Head and shouldersTrend reversalAt the top of a mature uptrend Double top / bottomTrend reversalAt significant highs or lows Ascending triangleBullish continuation or breakoutBelow a horizontal resistance level Descending triangleBearish continuation or breakdownAbove a horizontal support level Flag / pennantTrend continuationAfter a sharp impulsive move Volume: The Second Opinion
Volume measures how many shares, contracts or coins changed hands in a period. It tells you whether a price move has participation behind it. A breakout on strong volume is more credible than one on thin volume. A rally where volume steadily declines suggests fewer buyers are willing to chase price, which often precedes a pullback. In forex, true centralised volume is unavailable, so platforms display tick volume from their data feed; it is still a reasonable proxy for activity.
Moving Averages and Momentum Indicators
Indicators are calculations applied to price. They do not add new information, but they present existing information in ways that are easier to interpret consistently.
Moving averages
A simple moving average (SMA) is the mean closing price over a set number of periods; an exponential moving average (EMA) weights recent prices more heavily. Common settings are 20, 50 and 200 periods. Price above a rising moving average is a basic definition of an uptrend. When a shorter average crosses above a longer one, some traders read it as a bullish signal. Moving averages also act as dynamic support and resistance during trends.
Momentum indicators
The Relative Strength Index (RSI) compares recent gains to recent losses on a scale of 0 to 100. Readings above 70 are conventionally called overbought and below 30 oversold, though in strong trends the RSI can remain extreme for a long time. Divergence, where price makes a new high but RSI does not, is a more useful warning sign than the raw level. MACD tracks the difference between two EMAs and its own signal line, offering a view of momentum shifts. Stochastic oscillators work similarly by comparing the close to the recent range.
Beginners often stack five or six indicators on a chart and end up paralysed. Pick one trend tool and one momentum tool, learn them deeply, and let price action lead. On TradingView you can add indicators from the Indicators menu and save the combination as a template so every new chart opens the same way.
Multi-Timeframe Analysis
A market can be in an uptrend on the weekly chart, a pullback on the daily chart and a short-term bounce on the hourly chart all at once. Multi-timeframe analysis reconciles these views. A practical approach uses three levels: a higher timeframe to define the trend and major levels, an intermediate timeframe to find the setup, and a lower timeframe to fine-tune the entry. Trading in the direction of the higher-timeframe trend stacks the odds in your favour. TradingView’s multi-chart layouts let you view several timeframes of the same symbol side by side, which makes this process much faster.
Building a Simple Trading Plan
Analysis without a plan is just opinion. A trading plan converts your reading of the chart into a set of predefined decisions so that you are not improvising under pressure. Each trade should specify the following.
- Entry: The exact condition that triggers the trade, such as a bullish engulfing candle closing above a marked support zone on the four-hour chart.
- Stop loss: The price at which your idea is proven wrong. Place it beyond the structure you are trading against, not at an arbitrary distance.
- Take profit: A target based on the next resistance level, a measured move from a pattern, or a trailing method that follows the trend.
- Position sizing: Decide how much of your account you are willing to lose if the stop is hit, commonly one percent or less for beginners. Divide that money amount by the distance between entry and stop to get your position size. This step is what keeps a string of losses from being fatal.
- Risk/reward ratio: The potential reward divided by the potential loss. A setup risking 100 to make 200 has a 1:2 ratio. With a favourable ratio you can be wrong more often than you are right and still be profitable over time.
Write the plan down. A plan that lives only in your head will change the moment the market moves against you.
Trading plan checklist
- Identify the higher-timeframe trend and mark the major support and resistance zones.
- Define the setup you are waiting for, including the pattern and the level where it must appear.
- Specify the precise entry trigger, such as a candle close above or below a level.
- Place the stop loss beyond the invalidation point of the setup.
- Set a take-profit target and confirm the risk/reward ratio is at least 1:1.5, preferably 1:2 or better.
- Calculate the position size from your fixed risk per trade.
- Set alerts at the entry level so you are not glued to the screen.
- Execute only if every condition is met; skip the trade otherwise.
- Log the trade in your journal immediately after entry.
- Review the outcome and your adherence to the plan once the trade is closed.
Using Alerts and Watchlists to Execute the Plan
Most beginners lose money not because their analysis is bad but because they act on impulse. Alerts and watchlists remove the temptation to stare at charts and click. Build a watchlist of the instruments you understand, limit it to a manageable number, and review it at fixed times rather than continuously. For each setup you have planned, create a price alert at the level where you expect the trigger to occur. On TradingView you can set alerts on price levels, trendlines and even indicator conditions, and receive them by mobile notification or email. When an alert fires, you open the chart, check that the setup is confirmed, and execute according to the plan. If the confirmation is missing, you close the chart and wait. This discipline turns trading from a reactive activity into a calm, procedural one.
Backtesting with Bar Replay
Before risking real money, test whether your setup actually works. Bar replay on TradingView lets you rewind a chart to a chosen date and play it forward one candle at a time, hiding the future. Scroll back several months, identify setups as they form, note your hypothetical entries, stops and targets, and record the results. After thirty or forty replayed trades you will have a rough sense of the win rate and average risk/reward of your approach. This is not a rigorous statistical test, but it exposes flawed ideas quickly and builds pattern recognition far faster than live trading. It also teaches you how often the market presents your setup, which helps set realistic expectations about how many trades to take per week.
Journaling Your Trades
A trading journal is the single most effective improvement tool available to a new trader. For each trade, record the date, instrument, timeframe, setup type, entry, stop, target, position size, outcome and a screenshot of the chart at entry and exit. Add a short note about your emotional state and whether you followed the plan. Reviewing the journal weekly reveals patterns you cannot see in the moment: perhaps you consistently exit winners too early, or your losing trades cluster around a particular time of day or a setup you should stop trading. Many traders keep the journal in a spreadsheet and use TradingView‘s snapshot feature to capture the chart images.
Psychology and Common Mistakes
The technical side of trading can be learned in months; the psychological side takes longer. The most common errors are predictable and worth naming so you can watch for them.
- Overtrading: Taking trades that do not meet your criteria because waiting feels unproductive. Fewer, better trades almost always outperform.
- Moving the stop loss: Widening a stop to avoid taking a loss turns a small, planned loss into a large, unplanned one.
- Revenge trading: Jumping back in immediately after a loss to win the money back. This is emotion, not analysis.
- Indicator overload: Believing that more indicators mean more certainty. They mostly add conflicting signals.
- Ignoring the higher timeframe: Fighting a strong daily trend because of a minor hourly pattern.
- Position sizes that are too large: Even a good strategy fails if a few losses wipe out the account.
- Confirmation bias: Seeing only the evidence that supports the trade you already want to take.
Accept that losses are a normal cost of doing business. Your job is not to avoid them but to keep them small and consistent while letting the winners run according to the plan. Consistency of process, not any single trade, is what produces results.
Putting It Together
Start with clean candlestick charts and a handful of well-drawn support and resistance zones. Add one moving average and one momentum indicator, and check the higher timeframe before every decision. Write a plan with a defined entry, stop, target and position size, use alerts so you execute it calmly, and backtest it with bar replay before going live. Journal every trade and review honestly. Technical analysis rewards patience and repetition; give yourself the time to build the skill properly.
Frequently Asked Questions
Does technical analysis work for crypto as well as stocks and forex?
Yes. The patterns reflect crowd behaviour, which is similar across markets. Crypto tends to be more volatile and trades around the clock, so stop placement and position sizing need extra care, but the reading techniques are the same.
Which timeframe should a beginner start with?
Daily and four-hour charts are a good starting point. They move slowly enough to allow thoughtful decisions and produce cleaner patterns than very short timeframes, where noise and transaction costs dominate.
How many indicators do I need?
Very few. One trend indicator such as a moving average and one momentum indicator such as RSI is plenty. Price structure, support and resistance, and volume should carry most of the weight in your analysis.
Can I learn technical analysis without paying for tools?
Yes. The free tier of TradingView includes candlestick charts, drawing tools, popular indicators, watchlists and a limited number of alerts, which is more than enough to learn and practise everything covered in this guide.
